Computers Use eBird Data to Model Probabilities of Bird Sightings
By Art Munson and Daniel Sheldon
July 15, 2009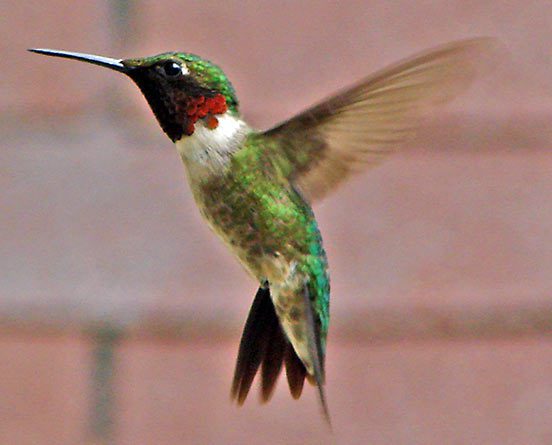

Students analyze millions of observations to learn about birds
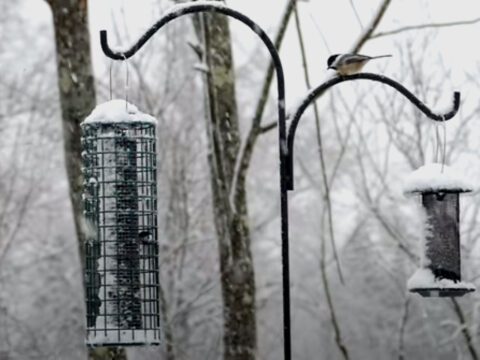
Where do Chestnut-sided Warblers live in winter? Why are Eurasian Collared-Doves expanding their range? How can conservation land best be managed to protect vulnerable species? A team of scientists and graduate students from Cornell University’s Computer Science and Statistical Science departments and the Cornell Lab of Ornithology are seeking answers using data from eBird and Project FeederWatch.
The body of data—22 million observations from hundreds of thousands of checklists—provides a unique opportunity to study and model the complete life cycle of many bird populations. But to deal with so much data, computer modelers must program computers to “learn” on their own, using a technique calledsupervised machine learning.
The programmers provide many observations from citizen-science projects, including date, location, time, duration of the observation, and distance traveled, and additional data such as terrain, habitat, and human population density, and the computer “learns” to make predictions. For example, it can generate a map showing the probability of spotting a Ruby-throated Hummingbird during a one-hour period on a given date in different parts of the United States.
These models are large, complex, and far from perfect, so a key step in drawing conclusions is to ask an expert ornithologist if the predicted relationships and generated maps make biological sense. Birds move around frequently and over large areas, some species are secretive, and observer expertise varies. Researchers hope to create models that take into account observers’ experience and use many checklists from the same area to estimate the detection rate, providing a more accurate estimation of each bird’s abundance. It’s especially difficult to get accurate numbers for some species of conservation concern—some rare birds are difficult to detect, and when one does appear, it may become a “hotline bird,” entered on many checklists and suddenly seeming more abundant than it is.
Tracking Migration
In 2007, computer science and applied math researchers Dan Sheldon, Dexter Kozen, and Saleh Elmohamed used eBird data and data on the locations of poultry centers to model how avian influenza might spread via wild bird migration, the first time migratory information has been used in an epidemiological model. First, they created animated maps of North America showing every observation for various migratory species throughout the course of a year. These simple graphics can display striking large-scale patterns of migration. For example, the Ruby-throated Hummingbird animation shows a wave of sightings spreading north from the Gulf Coast starting in late March and filling the entire eastern United States by mid-May.
Despite the vivid patterns in these animations, they contain little explicit information—spots on the map simply “light up” at locations and times where and when someone has spotted a given species. It is the viewer who “connects the dots” to infer a pattern. For example, as Ruby-throated Hummingbirds advance north in the spring, we guess that individual birds are flying fairly directly north as well. However, this is not the only possible explanation: half of the birds could be moving northeast and half northwest. A crisscross pattern seems unlikely, but to be certain, the team developed a probabilistic model to make educated guesses for aspects of migration that can’t be seen (such as how many birds move on different flight paths) given things that can be seen (such as the weekly distribution of birds). They hypothesized that each bird flies between locations at random but is more likely to fly short distances than long distances in a given time period. Then among all the models that could explain the weekly pattern of observations, they solved for those that are most mathematically probable.
Interestingly, the models and algorithms the team developed to solve this problem have their roots in speech recognition programs, another extremely complex task involving supervised machine learning. Birds can’t tell us what they’re doing, but with enough data and sound programming, a computer can make some pretty good guesses.
Art Munson and Daniel Sheldon are graduate students in Computer Science working with the Avian Knowledge Network.
Originally published in the July 2009 issue of BirdScope.


All About Birds is a free resource
Available for everyone,
funded by donors like you


