eBird Users Supply Information for 2011 State of the Birds Report
By Pat Leonard
July 15, 2011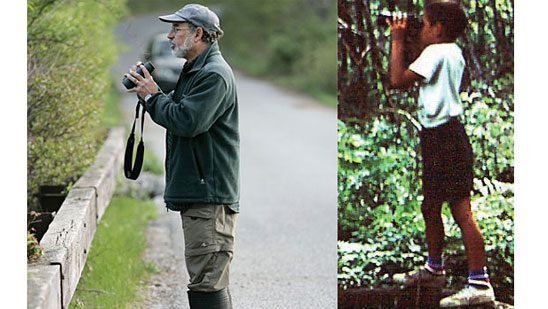

This issue of BirdScope features the State of the Birds 2011 report, a monumental effort to assess how well our public lands conserve bird populations, species by species (see Ths Land Is Their Land). Twenty agencies and organizations collaborated on the data analysis, which drew on more than 600,000 bird sightings submitted by the public to eBird (www.ebird.org), a joint program of the Cornell Lab of Ornithology and Audubon.
The director of Conservation Science at the Cornell Lab, Ken Rosenberg, like many of the report’s authors, is a lifelong birder. He helped shape the project that became eBird and he remains an avid user. From the earliest beginnings of his career, Rosenberg has sought better ways to record and compile data—an obsession that has stayed with him through the days of hand-drawn range maps, to online data entry, to projects like State of the Birds that would have been unthinkable even a decade ago.
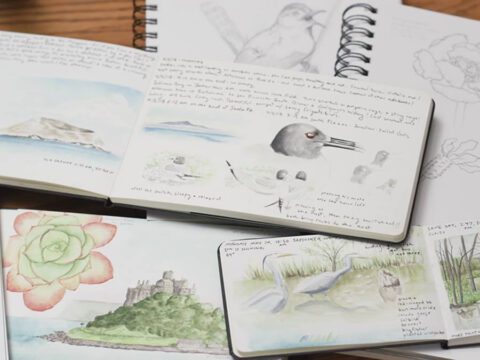
“My only memories of childhood are of birds. I would even dream about the birds I might see on family trips,” Rosenberg said. “And ever since I was a little kid it was important to me to write things down. I was just as excited about keeping track of birds in journals, checklists, and notebooks as I was about seeing the birds themselves.”
Rosenberg’s passion for birds and information about birds has never wavered. What has changed in the 40 years since he began watching birds is the mind-boggling amount of bird data that is now collected online through efforts like eBird and analyzed for projects such as the massive State of the Birds analysis.
When it comes to setting priorities and allotting finite resources, conservationists are flying blind without basic scientific information, Rosenberg said. The analyses and maps in State of the Birds now enable people to see how much of a species’ range occurs on public lands and which agencies are responsible for managing that land.
“This State of the Birds report is the first time we are able to say, for example, the Bureau of Land Management manages these 250 million acres of lands in the western U.S. and here’s a set of birds for which they have 50 percent or more of their entire world distribution on their land. That’s very compelling,” Rosenberg said.
The potential to cull meaning from vast amounts of data has skyrocketed since Rosenberg was a graduate student. In the seventies, it took 10 years of fieldwork, tedious data review, and handmade seasonal bar graphs and maps to produce theBirds of the Lower Colorado River, which Rosenberg coauthored during his Masters work at Arizona State University. Today he says you can pull up that same information in eBird in about 20 seconds.
With State of the Birds demonstrating what eBird can do to capture data and create maps of broad species distribution trends, the push is on to do the same at regional, state, and even refuge-level scales. “The maps we have now are better than anything we’ve ever had,” Rosenberg said. His dream now is to encourage more birders to use eBird to fill remaining gaps, and capture priceless historical data from Latin America. Scientists could then put it to use in partnership-led conservation projects that span the hemisphere and reflect the entire life cycle of declining Neotropical migrants.
“My generation did an incredible amount of exploration and kept field notes from all over the world,” Ken pointed out. “I’d love to see an organized effort with funding and volunteers to recover this historical data so it’s accessible to everyone.”
Originally published in the Summer 2011 issue of BirdScope.


All About Birds is a free resource
Available for everyone,
funded by donors like you


